How to find the Click-Through-Rate (CTR) in Google Analytics
The click-through rate (CTR) is one of the most important metrics to measure and evaluate ad performance.
If you activate the Tracking add-on and choose one of the two local tracking methods (Frontend, Database), Advanced Ads will automatically calculate and display the CTR values for you.
The situation is different if you connect the ad tracking with Google Analytics. In contrast to the local methods, Google Analytics does not calculate the CTR automatically.
Don’t worry about sitting in front of your analytics report with a calculator and figure out CTR values manually. This tutorial will show you how to automatically determine the CTR of your ads tracked with Google Analytics.
What the click-through rate (CTR) for ads means
Contents
The CTR indicates how many people that saw an ad finally also clicked on it.
With this value, you can measure how successful a particular ad is towards your users and whether they interact with it. Furthermore, you can check whether the placement is ideal and its design is right.
On the other hand, you can also quickly see from a low CTR the ad is performing poorly and that your users don’t feel addressed by it.
That’s why the CTR is one of the essential bases for optimizing your ad setup with A/B testing to achieve higher revenues.
The CTR is usually expressed as a percentage and calculated as follows:
CTR = Number of clicks/Number of impressions *100%
CTR = 200 (clicks) / 10.000 (impressions) *100% = 2,0%
Calculating the click-though rate with Google Analytics data
You will find the ad impressions and ad clicks tracked by Advanced Ads as individual events in your Google Analytics reports.
We’ll take a slight detour and export it to a Google Spreadsheet. In this way, we can automatically calculate the click-though-rate from this data in Google Analytics.
Please note that we provide the spreadsheet and the content on this page without any guarantee or support.
Connecting Google Analytics and Google Sheets
To import your data into Google Analytics, please open this spreadsheet first.
Then, copy the sheet under File > Make a copy and give your sheet a title, e.g., CTR Statistics.
Make sure that you are logged in with your Google Analytics account.
Now navigate to Add-ons > Get add-ons… in the spreadsheet and add Google Analytics.
The spreadsheet will then prompt you to allow access to your Google Analytics account. Once you have granted this access, we can start creating your CTR report.
Creating a new report for your Google Analytics CTR
We’ll start by creating a new report. Navigate to Add-ons > Google Analytics > Create new report.
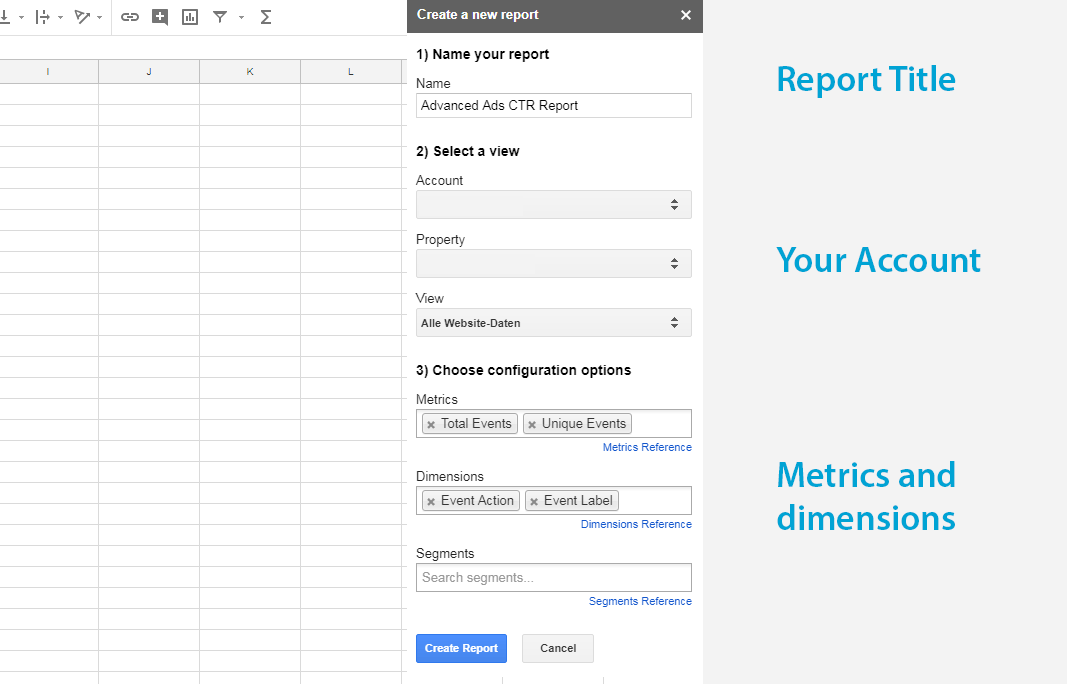
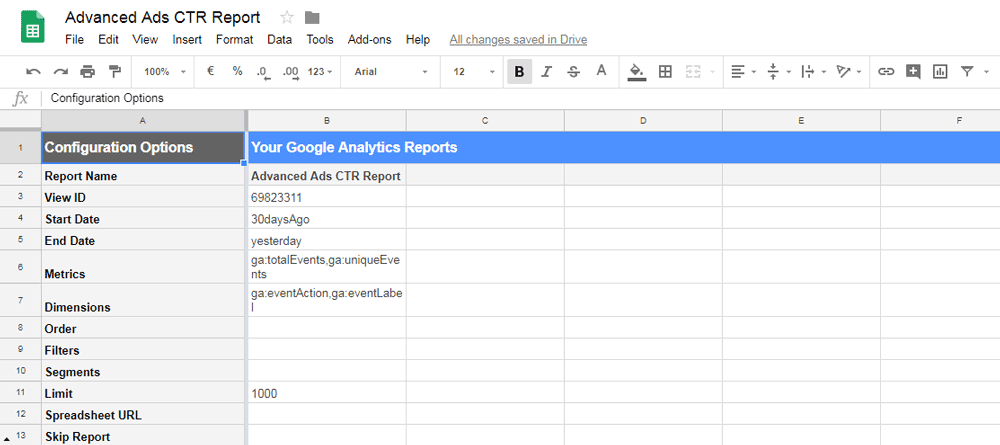
Choose a title, e.g., “Advanced Ads CTR Report”, and add the metrics and dimensions.
Copy the spreadsheet template and create your custom CTR report
When adding the metrics and dimensions, do that in the proper order, as shown in the screenshot below. Use the search field to find the metrics faster:
Afterward, click the “Create Report” button.
 Add the necessary Google Analytics metrics to your report
You can repeat this step and create a new report for each of your properties from that you want to calculate the CTR values.
Run your CTR report and import the data
Now, you can see the Report Configuration tab, the CTR Tool tab, and additional tabs for each property for that you created a new report in the step before.
 In the Report Configuration Options, you can edit, e.g., the reporting period
Click on Add-ons > Google Analytics > Run reports and import the data.
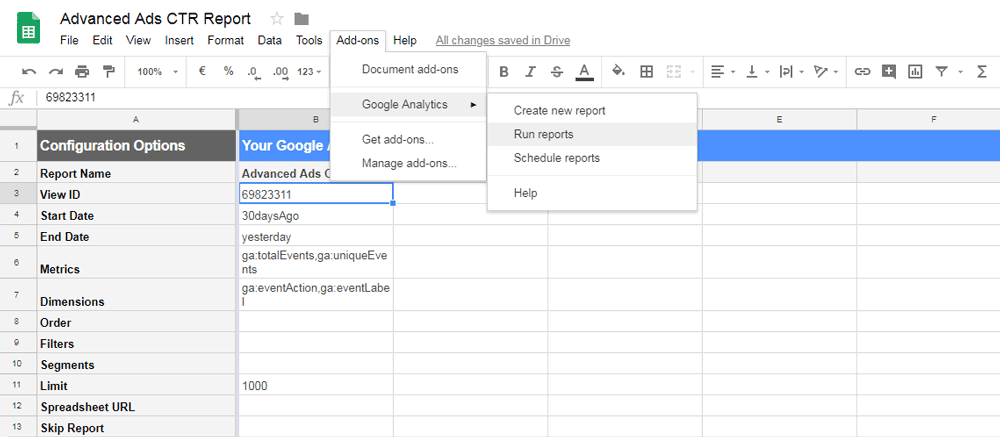 Clicking on “Run reports” will update the report data
Afterward, navigate to the CTR tool sheet and choose your property from the dropdown that you want to analyze.
This dropdown is the menu that shows “Advanced Ads CTR Report” on the screenshot below.
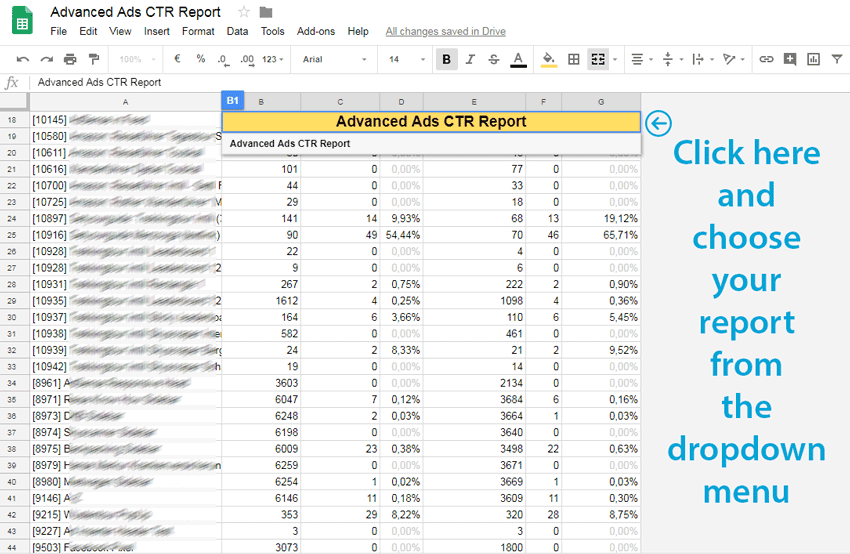 See and compare the click-through rates of your ads
Analyze the CTR of AdSense ads
If you want to analyze the performance of your AdSense ads with Google Analytics, I generally recommend connecting those services.
This way, Google Analytics extends the stored data by the aggregated key metrics of your AdSense account. However, the CTR is aggregated globally and displayed for all AdSense ads in the Google Analytics reports.
If, on the other hand, you want to compare the CTR values of individual, manually placed ads, you should not do this in Google Analytics.
Instead, you can find this data for individual ads in your AdSense reports (AdSense > Reports > Ad Units) and in the table of our CTR tool described above. This allows you to analyze the performance of each particular ad in detail.
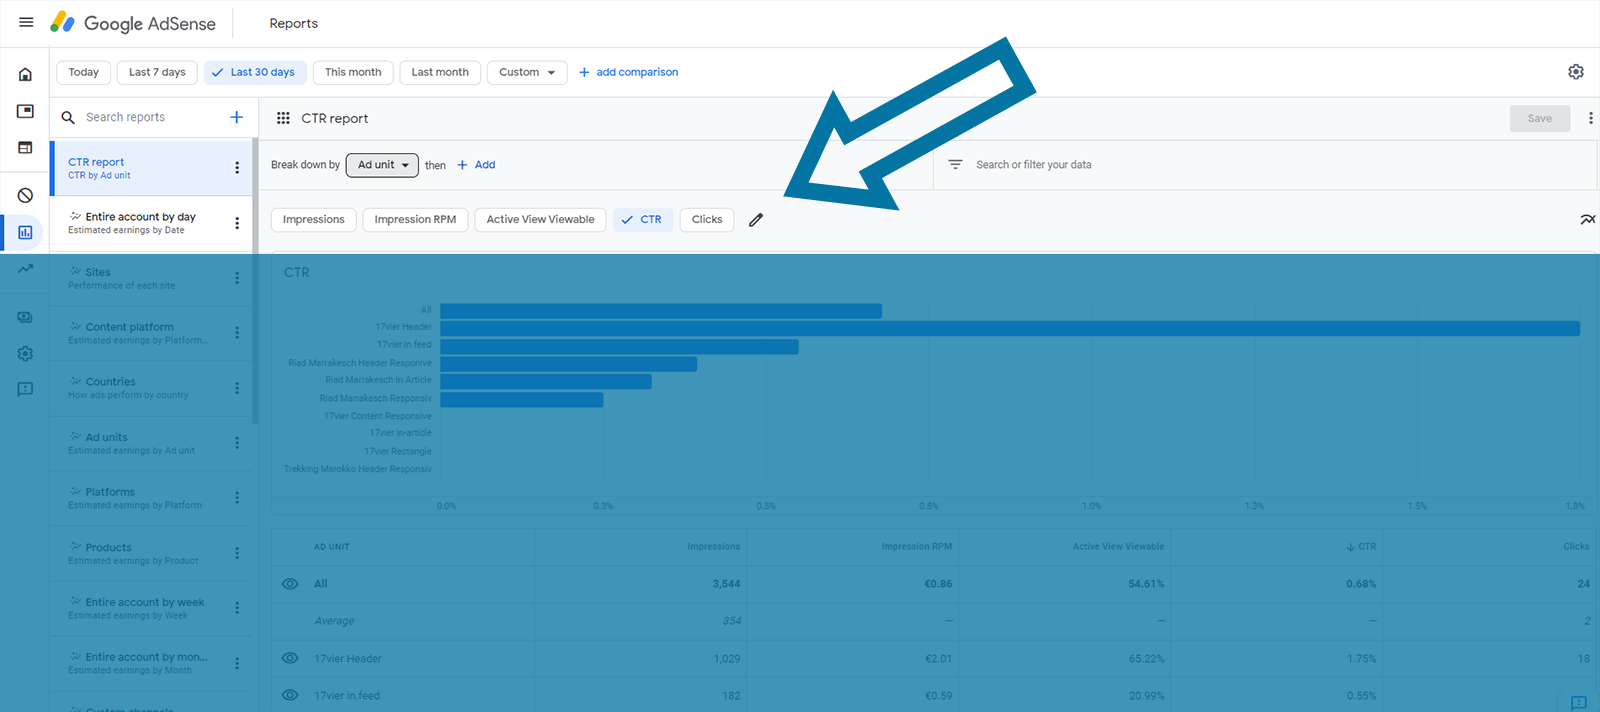 You can find the CTR performance of each ad unit in the AdSense reports
What else do you need to know
This workaround to automatically calculate the click-through rates of ads tracked with Google Analytics only supports properties that use the Universal Analytics tag.
If your property uses “Google Analytics 4”, you cannot export the event data to Google Sheets.

Joachim started marketing his first local news website in 2009. Shortly after, he successfully monetized his travel blogs about Morocco. He is an expert in affiliate marketing in the tourism and travel industry. When he’s not writing tutorials for Advanced Ads or supporting other users, he prefers staying in Marrakech or at the Baltic Sea.